This year’s winner of the Esri Canada GIS Scholarship is Agatha Czekajlo, an MSc student in the Integrated Remote Sensing Studio (Forest Resources Management Department, Faculty of Forestry, UBC). Her submission, the Vancouver Green Bus Atlas, classifies popular city bus routes according to their greenness – a measure that Agatha argues has positive impacts on riders’ well-being.
The Vancouver Green Bus Atlas uses Google Street View imagery as a source for street tree locations along popular Vancouver bus routes. Google Street View, Agatha believes, provides a more relatable measure of street-level greenness than aerial or satellite imagery-derived data because it more closely reflects what riders at street-level actually see.
VIEW THE FULL SUBMISSION
Agatha was asked to reflect on her project and write a short summary of her work and inspiration. Here is what she had to say:
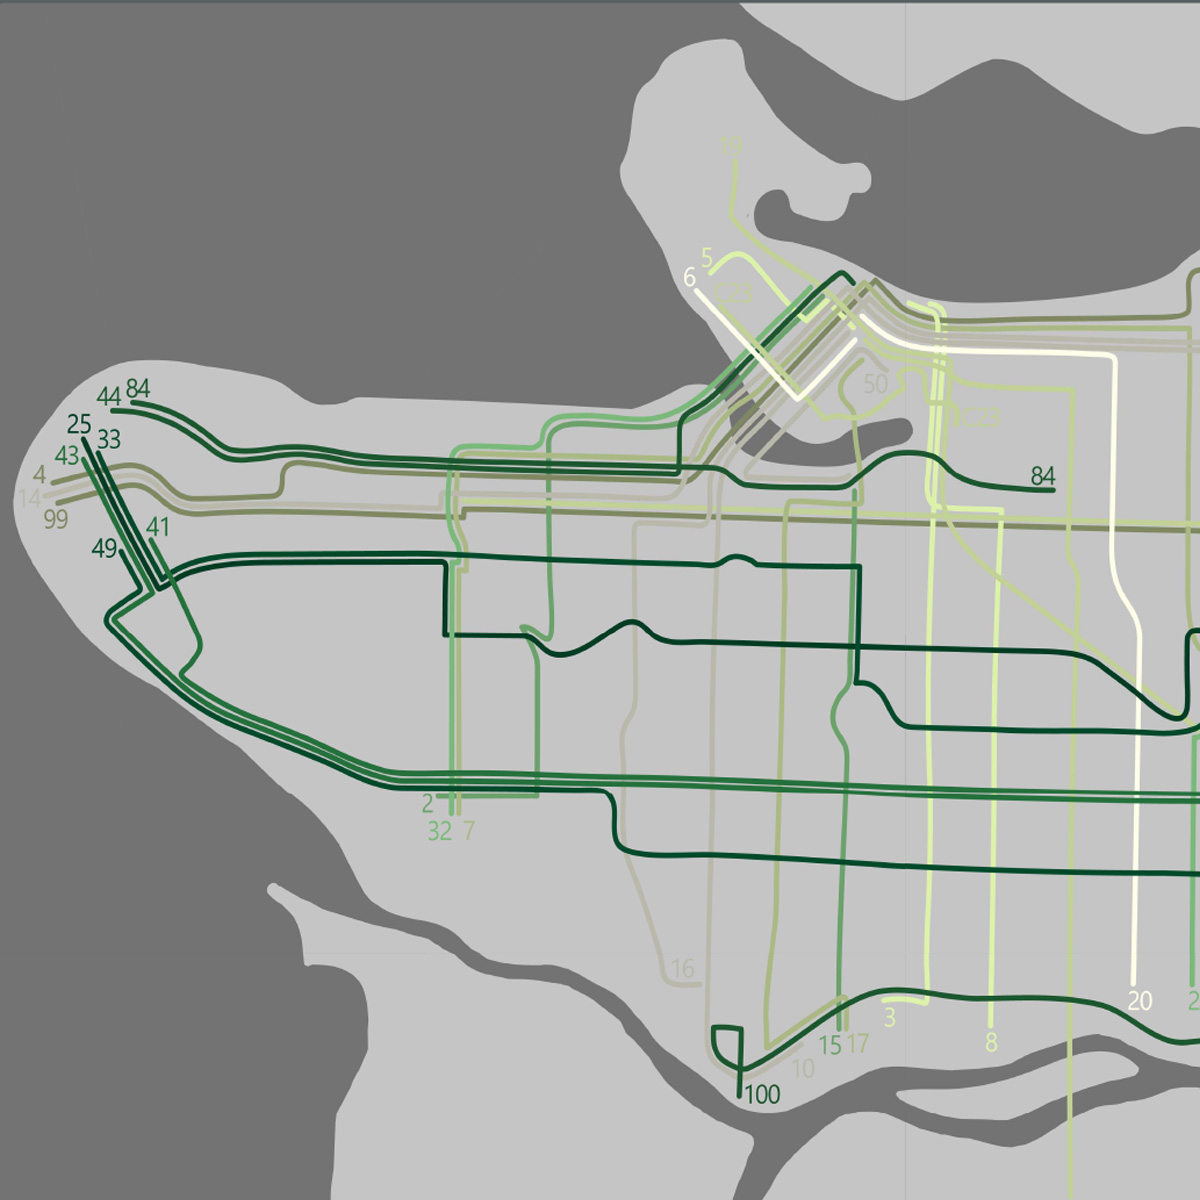
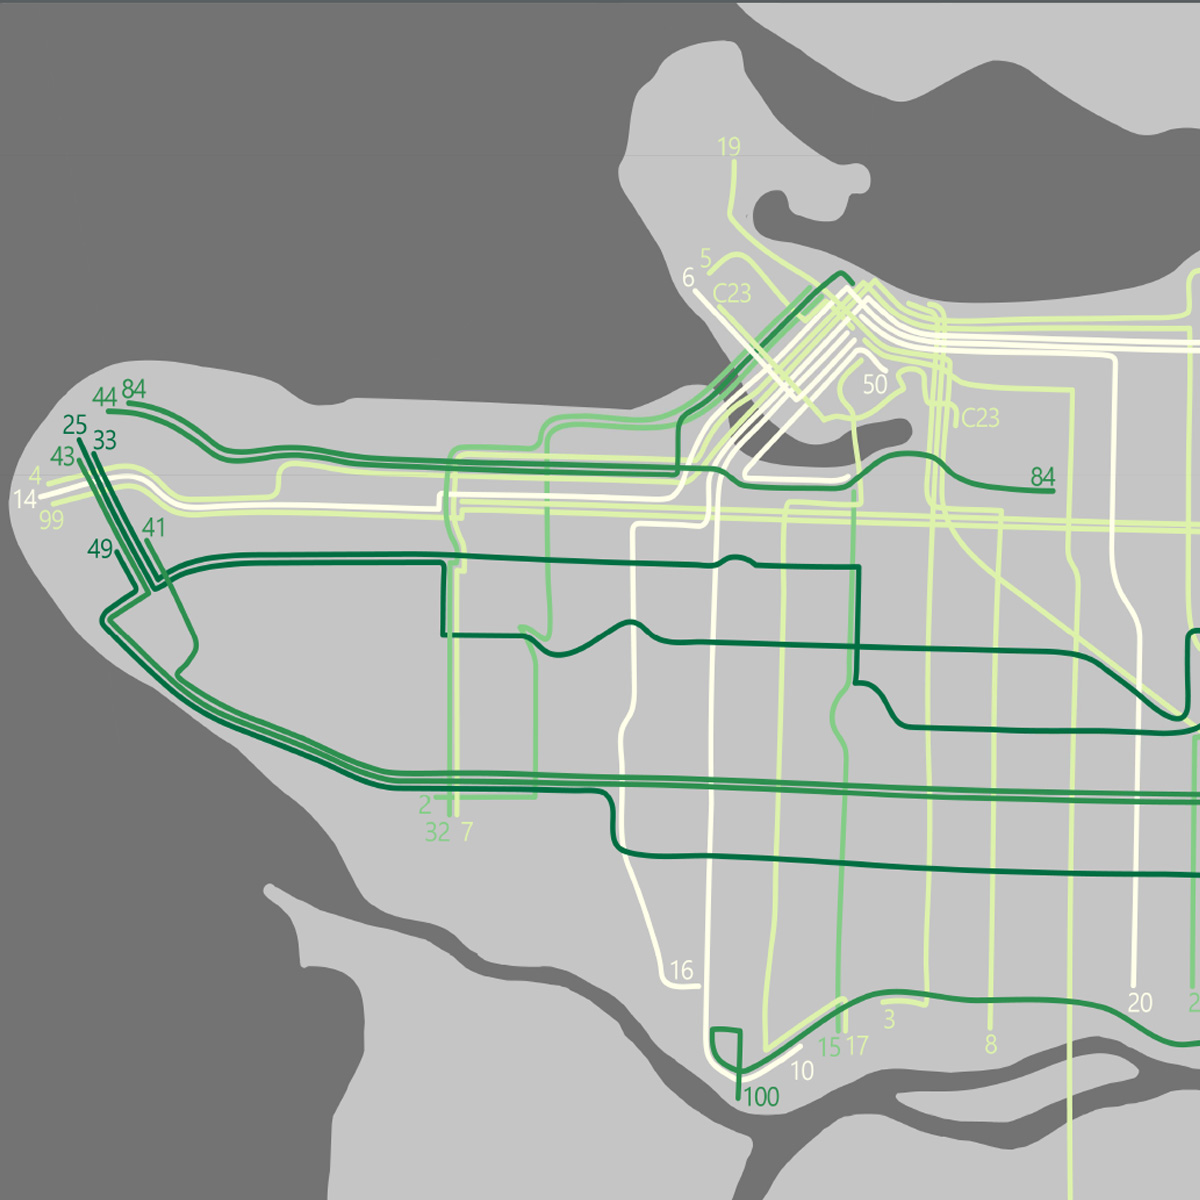
Ultimately I wanted to make sure the graphics I created were easy to understand, yet effectively explored the diversity of greenness along bus routes. For the spatial analysis I performed several data filtering and spatial statistics functions in ArcMap, such as Generate Points Along Line, Split Line at Point, Spatial Join, and Field Calculator. I chose to showcase bus route greenness using two maps. Firstly, the greenness spectrum map broadly illustrates how green each bus route is by showing the median tree fraction. The greenness matrix map, which shows the standard deviation of tree fractions in relation to the median tree fraction for each route, indicates the route’s level and variability of greenness. I also included more detailed maps of three routes, the #49, #99, and #10, which represent the most, average, and least green routes in Vancouver.
What I found most surprising was that the greenest bus route is the #49, one of the busiest in Vancouver. Coincidently this is also a route I would occasionally take home and enjoy. I think my results indicate that having greener bus routes, even busy ones, is possible in Vancouver, and investing in more trees along bus routes will benefit commuters as well as all Greater Vancouver citizens.
Esri Canada’s annual GIS Scholarship aims to support multidisciplinary studies with a focus on GIS at UBC. The scholarship awards a currently enrolled student with several prizes with the hopes to support them as they continue their studies as well as while they consider their post-graduate and career paths. Several dedicated student scholarship submissions are ranked annually according to several aspects of GIS and cartography including clarity, innovation, and graphic presentation. Congratulations to Agatha for her winning submission!